
Recently Hot and News
Featured Entries


-
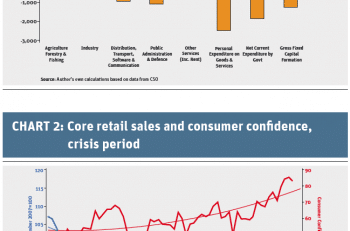
Outside multinationals it’s grim – even for property and competitiveness. By Constantin Gurdgiev ‘The national property price index peaked at 70.0 in December 2013 but slipped to 69.1 in March 2014’ In the recent elections Fine Gael and Labour insisted on recounting their successes in reversing the economic crisis: tens of thousands of jobs created, […]

-

Posted in:
Champions needed
Strong, principled women like Christine Buckley are essential for cultural change – by Ivana Bacik
-

Official Ireland is indifferent. This time about Donegal
-

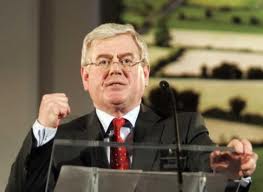
By Michael Smith. Eamon Gilmore needs to continue showing us his edge. “Triangulate: to move in the direction of a point by partly moving away from it”. For years the Irish Labour Party in general and its now leader, Eamon Gilmore in particular, have – characteristically – triangulated. They criticise a measure but pull their […]
-
Programme-renegotiation not enough as even finger-wagging becomes parody – John Gormley
-
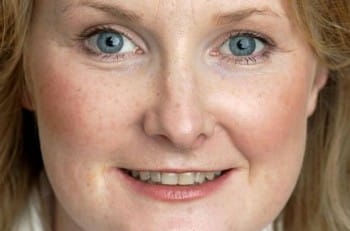
Mary Fitzpatrick interviewed by Michael Smith Councillor Mary Fitzpatrick, 44, was born and raised on the Navan Road in Dublin’s North Inner City, one of four children of Tom Fitzpatrick, a doctor and dentist who became a Fianna Fáil TD, She went to St Dominick’s in Cabra and to UCD where she studied politics and […]
-

Geni Murphy ‘the Victorian terrace due for demolition contains upstanding remains of a medieval manse house associated with one of the cathedral dignatories’. ‘The report notes: “the most recent archaeological report by V.J. Keeley has not been made available for consultation”’ Despite huge opposition, Kilkenny County Council stands resolved to push through the Central Access […]